
The amounts in this section exclude initiatives included in Budget 2018. These items will be included in future reports as they are approved.
Planned spending
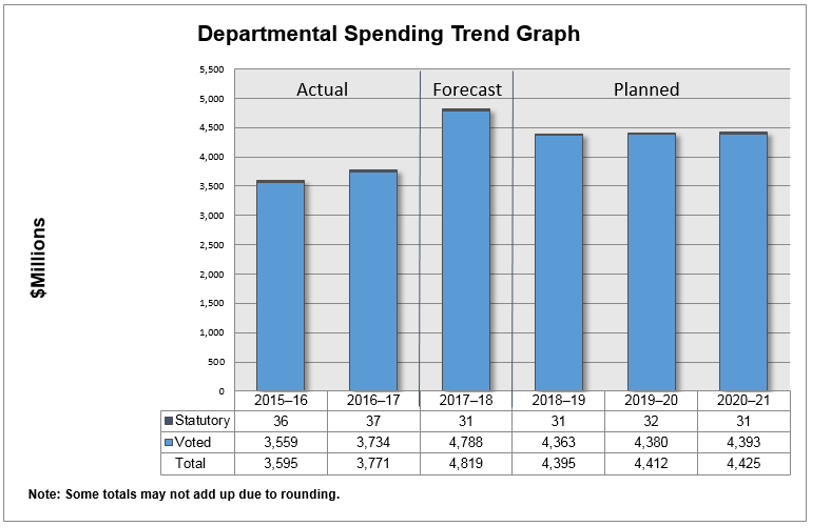
Departmental Spending Trend
Departmental Spending Trend ($ millions) – Table
| Spending | 2015–16 Actual |
2016–17 Actual |
2017–18 Forecast |
2018–19 Planned |
2019–20 Planned |
2020–21 Planned |
|---|---|---|---|---|---|---|
| Statutory Programs | 36 | 37 | 31 | 31 | 32 | 31 |
| Voted | 3,559 | 3,734 | 4,788 | 4,363 | 4,380 | 4,393 |
| Total Spending | 3,595 | 3,771 | 4,819 | 4,395 | 4,412 | 4,425 |
Note: Some totals may not add up due to rounding.
The Department’s budget fluctuates each year, because of the demand-driven nature of its programs, which are based on Veterans’ needs and entitlements. In other words, a Veteran who is entitled to a benefit is paid that benefit, whether 10 Veterans come forward or 10,000.
Excluding Budget 2018 announcements, VAC is forecasting that spending will decrease by 9% ($424 million) in FY 2018–19, when compared with forecast spending of $4.8 billion in FY 2017–18. The decrease is primarily attributable to funding in FY 2017–18 relating to the Budget 2016 initiative to increase the Disability Award. A one-time retro payment was made to all Veterans who received an Award since the introduction of the New Veterans Charter in 2006.
Planned spending is shown to increase in the outer years (2019–20 and 2020–21), as it is expected that the Department will see increased demand for many of its programs and services. Any additional funding required for this demand will be sought through future Estimates cycles to ensure all eligible Veterans receive the benefits and supports they require, regardless of the number that come forward.
Overall, approximately 90% of the Department’s budget represents expected payments to Veterans, their families and other program recipients. The Department continues to see an increase in the number of CAF Veterans and their families benefiting from VAC programs. At the same time, the number of war-service Veterans is declining, with surviving spouses becoming a larger segment of the population being served.
As a result of this demographic trend of more CAF Veterans and fewer war-service Veterans, forecasts show increased demand for programs such as Disability Awards (excluding the one-time retro payment) and Earnings Loss and Supplementary Retirement benefits, and a declining demand for traditional programs and benefits such as Disability Pensions and the War Veterans Allowance.
| Core Responsibilities and Internal Services | 2015–16 Expenditures | 2016–17 Expenditures | 2017–18 Forecast spending | 2018–19 Main Estimates | 2018–19 Planned spending | 2019–20 Planned spendingFootnote 6 | 2020–21 Planned spendingFootnote 6 |
|---|---|---|---|---|---|---|---|
| Benefits, Services and Support | 3,460,748,951 | 3,629,832,295 | 4,665,375,892 | 4,263,463,384 | 4,263,463,384 | 4,284,105,457 | 4,303,578,130 |
| Commemoration | 50,028,142 | 55,553,811 | 57,784,417 | 42,409,890 | 42,409,890 | 40,333,490 | 40,433,490 |
| Veterans Ombudsman | 4,600,441 | 4,630,182 | 5,076,840 | 5,386,623 | 5,386,623 | 5,386,623 | 5,386,623 |
| Subtotal | 3,515,377,534 | 3,690,016,288 | 4,728,237,149 | 4,311,259,897 | 4,311,259,897 | 4,329,825,570 | 4,349,398,243 |
| Internal Services | 79,656,670 | 80,792,453 | 91,034,875 | 83,294,535 | 83,294,535 | 82,137,640 | 75,219,527 |
| Total | 3,595,034,204 | 3,770,808,741 | 4,819,272,024 | 4,394,554,432 | 4,394,554,432 | 4,411,963,210 | 4,424,617,770 |
Spending for Benefits, Services and Support will decrease from FY 2017–18 to FY 2018–19. The 2017–18 budget included a one-time retro payment to all Veterans who received a Disability Award since the introduction of the New Veterans Charter in 2006.
If this one-time funding was removed from consideration, spending on Benefits, Services and Support increases each year, primarily due to the fact that demand for the Disability Award and Earning Loss and Supplementary Retirement programs continues to increase.
In regards to Commemoration, actual spending in FY 2016–17 and forecast spending is higher than in outer years. This is primarily related to spending for the commemoration of major milestones of the First World War – Battles of Vimy Ridge and Passchendaele, and the Second World War – Dieppe Raid, as well as spending on the 2017 Invictus Games held in Toronto, Ontario.
Planned spending within the Veterans Ombudsman program is expected to remain stable over the next three years.
Finally, approximately 2% of total planned spending is being allocated to Internal Services, which will support program delivery and the corporate obligations of the organization.
Planned human resources
| Core Responsibilities and Internal Services | 2015–16 ActualFootnote 8 |
2016–17 Actual |
2017–18 Forecast |
2018–19 Planned |
2019–20 Planned |
2020–21 Planned |
|---|---|---|---|---|---|---|
| Benefits, Services and Support | 2,294.1 | 1,887.2 | 1,981.8 | 1,951.1 | 1,951.1 | 1,951.1 |
| Commemoration | 83.7 | 91 | 89.6 | 89.6 | 89.6 | 89.6 |
| Veterans Ombudsman | 33.8 | 32 | 33.7 | 38 | 38 | 38 |
| Subtotal | 2,411.6 | 2,010.2 | 2,105.1 | 2,078.7 | 2,078.7 | 2,078.7 |
| Internal Services | 597.8 | 626 | 643.1 | 646.1 | 646.1 | 646.1 |
| Total | 3,009.4 | 2,636.2 | 2,748.2 | 2,724.8 | 2,724.8 | 2,724.8 |
Veterans Affairs Canada is continuing the trend of strengthening its front-line resources. Additional funding for Human Resources has been approved in each of the last three Federal budgets with a focus on improving the delivery of services and programs to Veterans, implementing new programs and improving existing programs.
Some of these efforts include: increased Case Management Services; the creation of three new benefits (Retirement Income Security Benefit, Critical Injury Benefit and Caregiver Recognition Benefit); increased Financial Benefits for Veterans (including Reservists); investments in mental health; and the re-opening of Veterans Affairs offices across the country.
Overall VAC will continue to maintain the front-line resource levels needed to deliver programs and services to Veterans and their families. Going forward, VAC will continue to work at identifying further opportunities to ensure ample resources are deployed where they are needed, in order to further strengthen and improve services and benefits for Veterans and their families.
Estimates by vote
For information on Veterans Affairs Canada’s organizational appropriations, consult the 2018–19 Main Estimates.
Future-Oriented Condensed Statement of Operations
The Future Oriented Condensed Statement of Operations provides a general overview of Veterans Affairs Canada’s operations. The forecast of financial information on expenses and revenues is prepared on an accrual accounting basis to strengthen accountability and to improve transparency and financial management.
Because the Future Oriented Condensed Statement of Operations is prepared on an accrual accounting basis, and the forecast and planned spending amounts presented in other sections of the Departmental Plan are prepared on an expenditure basis, amounts may differ.
A more detailed Future Oriented Statement of Operations and associated notes, including a reconciliation of the net cost of operations to the requested authorities, are available on the Veterans Affairs Canada website.
| Financial information | 2017–18 Forecast results |
2018–19 Planned results |
Difference (2018–19 Planned results minus 2017–18 Forecast results) |
|---|---|---|---|
| Total expenses | 4,821,286,324 | 4,404,601,616 | (416,684,709) |
| Total revenues | 0 | 0 | 0 |
| Net cost of operations before government funding and transfers | 4,821,286,324 | 4,404,601,616 | (416,684,709) |
The Estimated net cost of operations for FY 2018–19 is $4,404.6 million. Approximately 90% of the planned spending for FY 2018–19 is paid directly to or on behalf of the people VAC serves in the form of compensation and financial support, health care and commemoration.